
Click here to see other posts about FT-IR
Only 10 $ per sample for interpreting of your FT-IR spectrum
Payment Upon Completion
 Send your spectra...
FTIR Spectroscopy is an analytical technique used to identify organic, polymeric, and, in some cases, inorganic materials. The FTIR analysis method uses infrared light to scan testsamples and observe chemical properties. When trying to identify an unknown material, FTIR (Fourier Transform Infrared Spectroscopy) analysis is a great tool to answer, “What is it?”. It works well for solids, liquids and gases, and can be applied to pure substances or mixtures. Quantitative or qualitative analysis is available. FTIR is not the best technique to measure trace contaminants, but functions extremely well identifying bulk materials.
Are you trying to determine material composition, identify impurities, or track changes in your raw materials or finished product? FTIR can provide quality control for your manufacturing process. FTIR analysis also has regulatory compliance applications, such as Respirable silica (NIOSH 7602), for industrial hygiene at construction and petroleum fracking sites.
Fourier Transform Infrared Spectroscopy (or FTIR for short) identifies chemical bonds in materials via their infrared absorption spectrum. Transmission and Attenuated Total Reflectance (ATR) modes permit analysis of a wide range of solids, powders, non-aqueous liquids and gases.
The FTIR spectrum is the “infrared fingerprint” of the material. Qualitatively, unknowns can be identified by comparison with an extensive library of FTIR spectra. Our reference sample database includes tens of thousands of spectra for comparison purposes. Quantitatively, FTIR-ATR Analysis is often the first step in the materials analysis process due to its speed and simplicity.
Samples weighing as little as 50 milligrams can be evaluated using FTIR-ATR analysis. The small sample size allows for selective identification of particles, residues, films or fibers.
Applications of FTIR Transmission & ATR Analysis:
- Quantitative Scans
- Qualitative Scans
- Solids
- Non-Aqueous Liquids
- Organic Samples
- Inorganic Samples
- Unknowns Identification
- Impurities Screening – Routine QA/QC analysis with Accept/Reject limits
- Soil Pharmaceuticals
- Paints, Coatings
- Laminates
- Assessing purity – raw materials, intermediate materials, finished product
- Polymers, plastics – Identifying:
- Base polymer composition
- Additives
- Organic contaminants
- General type of material being analyzed when there are unknows
- Common Household Items
- Cleansers and Detergents
- Baking Powders and Ingredients
- Paints
- Oils
- Paper
- Medications
- Fibers
- Synthetic Fibers (acrylic, nylon, polyester, rayon)
- Natural Fibers (cotton, silk, wood)
- Adhesives
- Glue
- Epoxy
- Resin
- Biodiesel Content in Diesel Fuel
- Trace Level (0.025%) measurement for biodiesel averse applications
- Gross composition
Qualitative Scans
Qualitative scans can be used to rapidly assess unknown materials for identification and for rapid checks on impurities. In terms of process QC, high quality spectral scan of your reference material(s) can be generated and stored in our spectral library database and quickly compared to new materials in your manufacturing process and flag them as acceptable or unacceptable.
Quantitative Scans
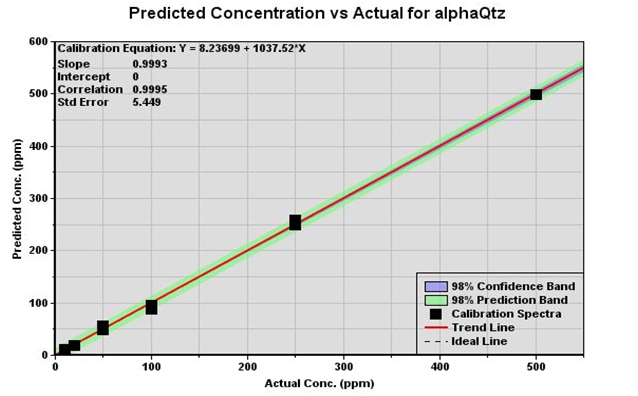
A wide variety of materials can be quantified using the FTIR-ATR materials characterization technique. Quantification requires that a standard calibration curve of known concentrations be created. This is how FTIR is used for the analysis of respirable silica using the NIOSH 7602 method or for determining low levels of Biodiesl in diesel fuel.
ATR-FTIR can be effectively used for quantitative analysis. Non-destructive measurement of samples is possible using ATR-FTIR. Prepare known concentrations of your samples and analyze. For this you must know the prominent IR peak in your sample. Measure peak heights/areas and prepare a calibration curve. From this you can determine the concentration in unknown sample by noting peak height. It depends on what kind of material you are analyzing. If your material varies in composition as a function of time or temperature, the thickness of your sample may vary too (e.g. due to evaporation of solvent etc). In such case, you have to select a peak that remains constant (not shifting) during the entire process. In absorption mode, find out the area (not the height) of the main peak (of your interest) and divide with the area of the constant peak.
Below is our calibration for respirable alpha silica using NIST standards:
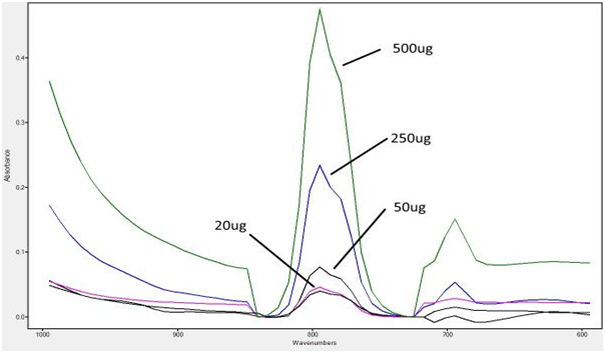
A few of the spectra used in this calibration (from NIST Standards) are shown below:
How do I find the area under my curve using origin?
Plot your data (if you have not already) and make the graph window active, you can either use Integration gadget or Peak Analyzer.
For Integration gadget, go to Gadgets:Integrate… and click OK in the coming up dialog to bring up the yellow Region of Interest (ROI) box. Drag to position and resize the box to the area you want to calculate, then the Area and FWHM information will show up on the ROI top.
For Peak Analyzer, follow the steps below:
- Choose Analysis: Peaks and Baseline: Peak Analyzer.
- In the first page (the Goal page), select the Integrate Peaks radio button in the Goal group.
- For nominal data with positive and negative peaks, step through the four steps in the dialog window: Baseline Mode, Subtract Baseline, Find Peaks and Integrate Peaks.
- The resulting plot will label each peak with the x-coordinates.
- The workbook containing results output shows the calculated result parameters for each peak, including peak areas, in the Integration_Resultn worksheet. The data for the integral curve can be found in the Integrated_Curve_Datan worksheet.
How To Calculate Area Under A Plotted Curve In Excel?
For example, you have created a plotted curve as below screenshot shown. This method will split the area between the curve and x axis to multiple trapezoids, calculate the area of every trapezoid individually, and then sum up these areas.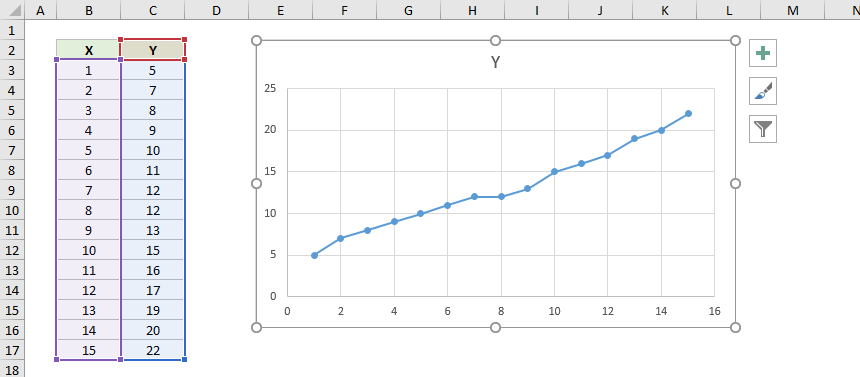
1. The first trapezoid is between x=1 and x=2 under the curve as below screenshot shown. You can calculate its area easily with this formula: =(C3+C4)/2*(B4-B3). 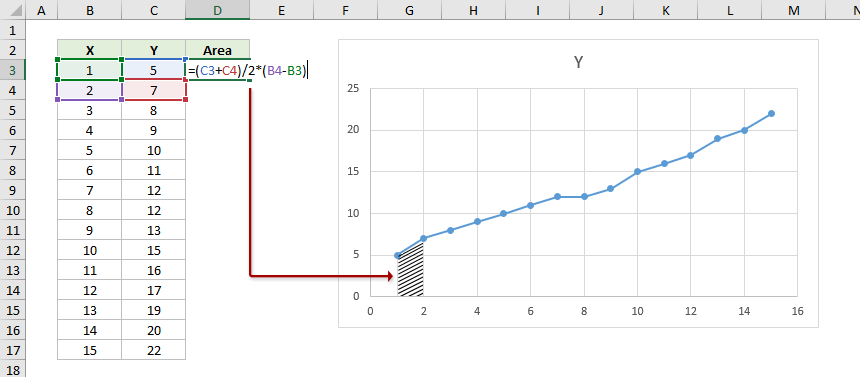
2. Then you can drag the AutoFill handle of the formula cell down to calculate areas of other trapezoids.
Note: The last trapezoid is between x=14 and x=15 under the curve. Therefore, drag the AutoFill handle to the second to last cell as below screenshot shown. 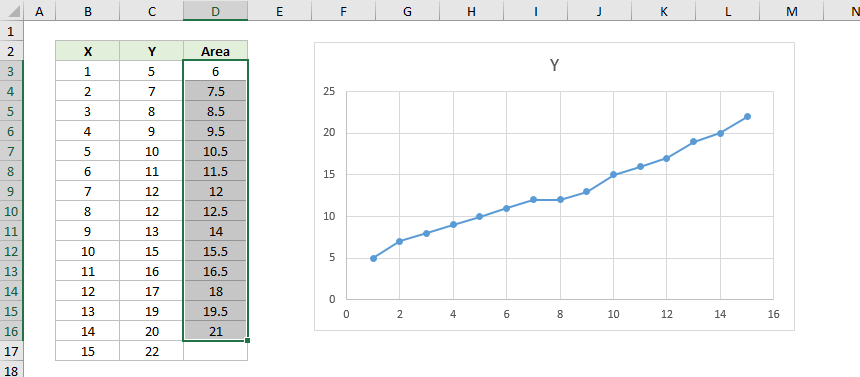
3. Now the areas of all trapezoids are figured out. Select a blank cell, type the formula =SUM(D3:D16) to get the total area under the plotted area.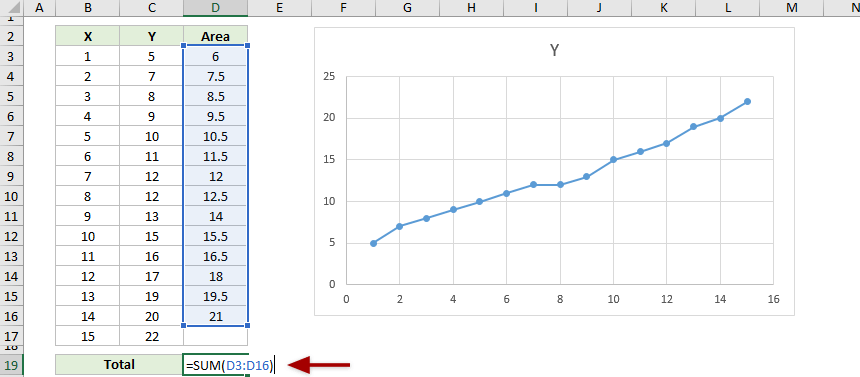
Calculate Area Under A Plotted Curve With Chart Trendline
This method will use the chart trendline to get an equation for the plotted curve, and then calculate area under the plotted curve with the definite integral of the equation.
1. Select the plotted chart, and click Design (or Chart Design) > Add Chart Element > Trendline > More Trendline Options. See screenshot: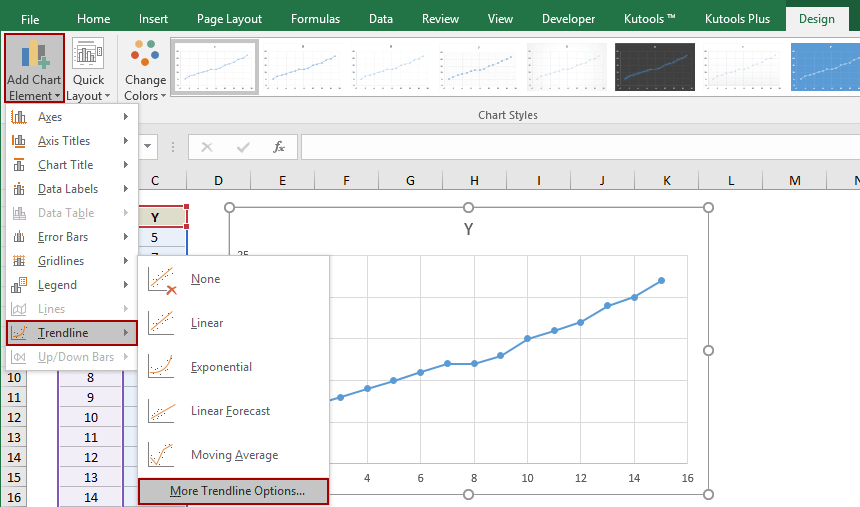
2. In the Format Trendline pane:
(1) In the Trendline Options section, choose one option which is most matched with your curve;
(2) Check the Display Equation on chart option. 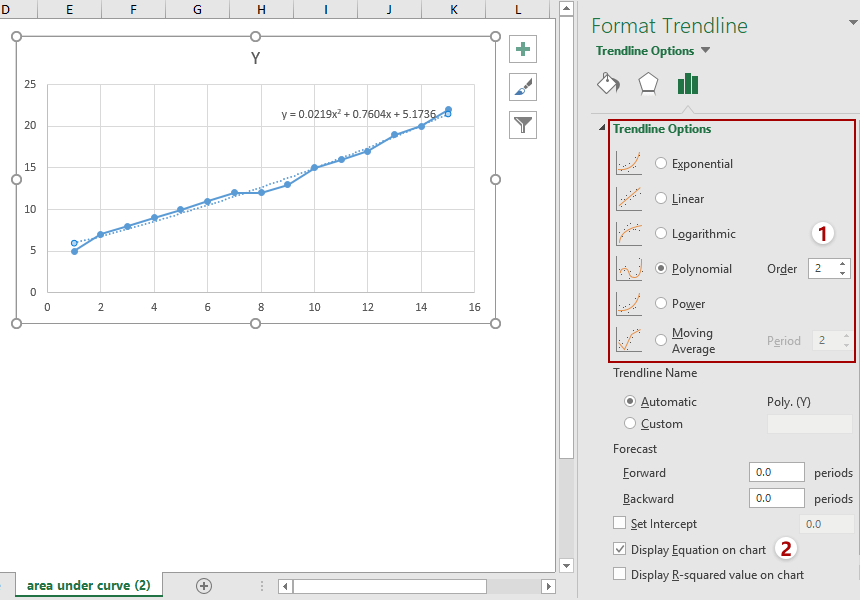
3. Now the equation is added into the chart. Copy the equation into your worksheet, and then get the definite integral of the equation.
In my case, the equation general by trendline is y = 0.0219x^2 + 0.7604x + 5.1736, therefore its definite integral is F(x) = (0.0219/3)x^3 + (0.7604/2)x^2 + 5.1736x + c.
4. Now we plug in the x=1 and x=15 to the definite integral, and calculate the difference between both calculations results. The difference represents the area under the plotted curve. 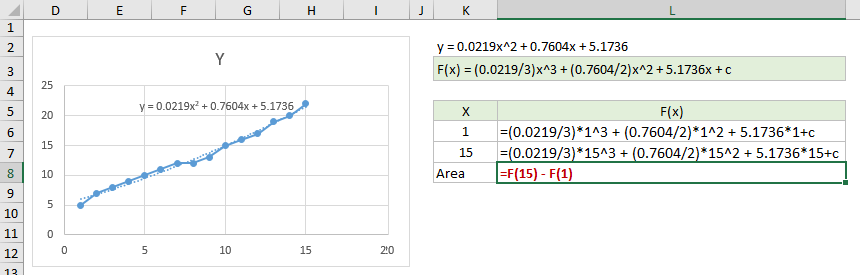
Area = F(15)-F(1)
Area =(0.0219/3)*15^3+(0.7604/2)*15^2+5.1736*15-(0.0219/3)*1^3-(0.7604/2)*1^2-5.1736*1
Area = 182.225
