Unveiling the Mysteries of Mxene: Exploring 5 Advanced Characterization Methods (XRD, Raman, XPS, UV-Vis, and FT-IR) for Enhanced Material Understanding

Mxene
Only 10 $ per sample for interpreting of your FT-IR, Raman, XRD, UV-Vis, and XPS spectrum Payment Upon Completion Send your spectra... What is Mxene? Mxene is a class of two-dimensional (2D) transition metal carbides, nitrides, and carbonitrides that exhibit unique properties such as high electrical conductivity, excellent mechanical strength, and high surface areas. M...
Read more

How can falsify XPS, XRD, FTIR, Raman, SEM, etc. data?

We may be able to help you achieve your goal...! Just contact us and submit your request ;-) Falsification of data in a paper refers to the deliberate manipulation or fabrication of research data to support a particular hypothesis or conclusion. This can include altering or omitting data, selectively reporting results, or creating false data altogether. (more…)
Read more

How to calculate unknown concentration using UV-Vis spectroscopy?

How to calculate unknown concentration using UV-Vis spectroscopy?
Click here to see more posts about UV-Vis spectroscopy Only 10$ per sample for interpreting of your UV-Vis spectrum Payment Upon Completion Send your UV-Vis spectra… It is well known that determination of concentrations of materials in different solutions is an important step for investigation of the under-studied solution. Usually, photometric techniques ...
Read more

Determination of band gap using UV-Vis spectra

Determination of band gap using UV-Vis spectra
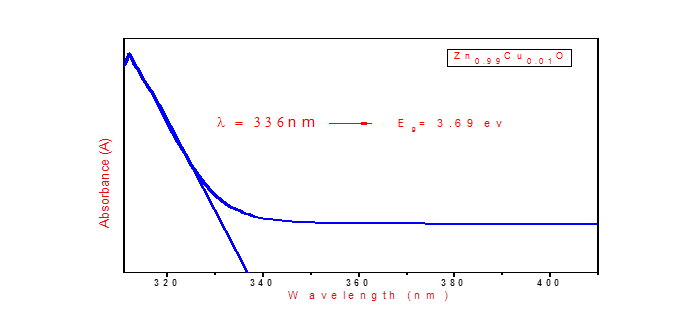
Click here to see more posts about UV-Vis spectroscopy Only 10$ per sample for interpreting of your UV-Vis spectrum Payment Upon Completion Send your UV-Vis spectra... STEP1: Open the absorption graph of the material, which is obtained from the UV Vis spectroscopy. Theory Behind Calculations: UV Vis Spectroscopy absorption peak means the Electrons are abs...
Read more

Everythings about UV-Vis spectroscopy

Everythings about UV-Vis spectroscopy
Click here to see more posts about UV-Vis spectroscopy Only 10$ for interpretation of your UV-Vis spectrum Payment Upon Completion Send your UV-Vis spectra... In Figure 10.9 we examined Nessler’s original method for matching the color of a sample to the color of a standard. Matching the colors was a labor intensive process for the analyst. Not surprisingly, spectroscop...
Read more

A to Z of UV-Vis spectroscopy interpretation

A to Z of UV-Vis spectroscopy interpretation
Click here to see more posts about UV-Vis spectroscopy Only 10$ for interpretation of your UV-Vis spectrum Payment Upon Completion Send your UV-Vis spectra... While interaction with infrared light causes molecules to undergo vibrational transitions, the shorter wavelength, higher energy radiation in the UV (200-400 nm) and visible (400-700 nm) range of the electromagne...
Read more

How to analyze UV-Vis spectra?

How to analyze UV-Vis spectra?
Click here to see more posts about UV-Vis Only 10$ for interpretation of your VSM curve Payment Upon Completion Send your VSM curves... An obvious difference between certain compounds is their color. Thus, quinone is yellow; chlorophyll is green; the 2,4-dinitrophenylhydrazone derivatives of aldehydes and ketones range in color from bright yellow to deep red, dependin...
Read more