Quantification of FT-IR spectrum

Quantification of FT-IR spectrum
Click here to see other posts about FT-IR Only 10 $ per sample for interpreting of your FT-IR spectrum Payment Upon Completion Send your spectra... 
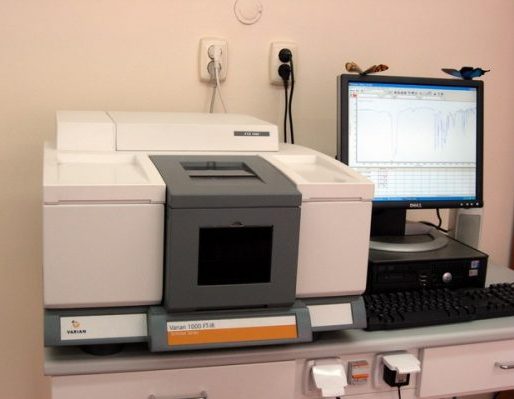
FTIR Spectroscopy is an analytical technique used to identify organic, polymeric, and, in some cases, inorganic materials. The FTIR analysis method uses infrared light to scan testsamples and observe...
Read more

A to Z of IR Spectroscopy

A to Z of IR Spectroscopy
Click here to see other posts about FT-IR Only 10 $per sample for interpreting of your FT-IR spectrum Payment Upon Completion Send your spectra... Infrared (IR) spectroscopy is based on molecular vibrations caused by the oscillation of molecular dipoles. Bonds have characteristic vibrations depending on the atoms in the bond, the number of bonds and the orientation of ...
Read more

Fundamentals of Fourier Transform Infrared spectroscopy

Click here to see other posts about FT-IR Only 10 $ for interpretation of your FT-IR spectrum Payment Upon Completion Send your spectra... Infrared (IR) spectroscopy is a chemical analytical technique, which measures the infrared intensity versus wavelength (wavenumber) of light. Based upon the wavenumber, infrared light can be categorized as far infrared (4 ~ 400cm‐1)...
Read more

Different type of amines in FT-IR spectroscopy

Click here to see other posts about FT-IR Only 10 $ for interpretation of your FT-IR spectrum Payment Upon Completion Send your spectra... The N–H stretches of amines are in the region 3300-3000 cm-1. These bands are weaker and sharper than those of the alcohol O–H stretches which appear in the same region. In primary amines (RNH2), there are two bands in thi...
Read more

Free software for FTIR analysis

Click here to see other posts about FT-IR Only 10 $ for interpretation of your FT-IR spectrum Payment Upon Completion Send your spectra... Protea: https://www.protea.ltd.uk/free-ftir-software.htmlIRPal: https://irpal.soft112.com/OriginLab (The trial version is fully functional):https://www.originlab.com/demodownload.aspx (more…)
Read more

Steps of FTIR interpretation

Click here to see other posts about FT-IR Only 10 $ for interpretation of your FT-IR spectrum Payment Upon Completion Send your spectra... 1. Determine the X-axis and the Y-axis of the spectrum. The X-axis of an IR spectrum is labeled as "Wavenumber" and ranges in number from 400 on the far right to 4,000 on the far left. The X-axis provides the absorption number. The...
Read more