Click here to see more posts about NMR
Only 15$ for interpretation of your NMR spectrum
Payment Upon Completion
Send your results...
This handout relates the basic theory of NMR described on the theory web handout with spectra of real molecules and how to deduce structure from the spectra. Before reading this handout, you need to be thoroughly familiar with all of theory concepts that were described.

1.0 The NMR spectrum.
1.1 Because different amounts of electron density are around different non-eqivalent nuclei, the different non-equivalent nuclei in a molecule are experiencing slightly different net magnetic fields in an NMR experiment (Review Section 5.2A of the theory handout). Recall also that the difference in energy between the two allowed spin states (+1/2 and -1/2 spin states) of a spin 1/2 nucleus (like in 1H and 13C nuclei) depends on the exact magnetic field felt by the nucleus (Review Section 2.3Cin the theory handout). Recall further that in the NMR experiment, when and only when nuclei are irradiated with electromagnetic radiation of energy that exactlycorresponds to the energy difference between the +1/2 and -1/2 spin states, the nuclei absorb the energy and the NMR spectrometer measures this absorbance (Review section 3.1 of the theory handout). The absorbance of energy to convert a nucleus from a +1/2 to a -1/2 spin state is referred to as “resonance” of that nucleus.1.1A The key conclusion is that nuclei with different electron densities have +1/2 and -1/2 spin states that differ in energy by differing amounts, so these nuclei will absorb electromagnetic radiation of different frequencies in the NMR experiment.
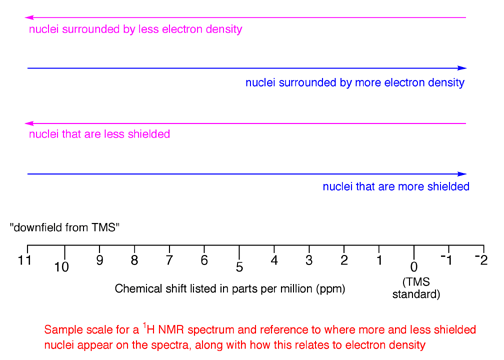
1.1B Nuclei surrounded by greater amounts of electron density will be more shielded from the external magnetic field, so they will absorb electromagnetic radiation of lower energy, that is, lower frequency (energy is proportional to frequency). You may want to review Section 5.2A of the theory handout again.
1.1C The converse is also true, namely that nuclei surrounded by lesser amounts of electron density will be less shielded (referred to as being “deshielded”) from the external magnetic field, so they will absorb electromagnetic radiation of higher energy, that is, higher frequency(energy is proportional to frequency).
1.1D The three most important factors influencing the electron density around a hydrogen nucleus are: (i) adjacent electronegative atoms remove electron density; (ii) hybridization of the attached carbon atom, increasing shielding is observed in the order sp2, sp, sp3; (iii) adjacent pi bonds are deshielding, which relates to (ii).1.2 An NMR spectrum is a plot of absorbance versus frequency.
1.2A To make different spectra directly comparable, a standard is used for all NMR spectra. For 1H NMR spectra, the standard is called tetramethylsilane (TMS) and a small amount of TMS is usually added to any 1H NMR sample.
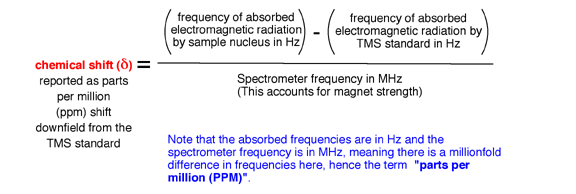
1.2B Magnets of different strengths lead to absorbance of electromagnetic radiation at different frequencies for the same nucleus, meaning that if simple frequency were plotted in an NMR spectra, you could not compare spectra taken of the same sample on machines with different magnet strengths. To solve this problem, the frequency of absorption plotted on NMR spectra are corrected for the magnet strength. In addition, frequency is correlated to the reference compound TMS. The frequency at which TMS absorbs is defined as 0 frequency by convention. In the NMR spectrum, absorbance frequencies of electromagnetic radiation are plotted as chemical shift (d) listed in units called parts per million (ppm) that is defined by the following equation:


1.3 The bottom line to this entire section is that the hydrogen atoms of different functional groups (methyl groups, -CH2- groups, aldehyde -C(O)H, alkene C-H, etc.) have characteristic chemical shifts, i.e. absorbance frequencies. These characteristic chemical shifts are collected in tables such as Fgure 13.8 and Appendix 4 of your book. From the chemical shift information, you thus know what functional groups are present in a molecule.

1.4 Chemically equivalent hydrogen atoms will have the same chemical shift and therefore give rise to the same signal. This is why we defined equivalent atoms in Section6.1 of the theory handout. Non-equivalent groups of hydrogens will have different chemical shifts. Thus, you will have as many different signals in an NMR spectrum as there are chemically non-equivalent groups of hydrogen atoms.
2.0 The nuclear spin of hydrogen atoms creates a magnetic field that influences the chemical shift of nearby hydrogen atoms (Review Sections 5.1 and 5.2).
2.1 Nuclear spin magnetic fields will influence hydrogen atoms that are three or fewer bonds away from each other in the same molecule. Hydrogen atoms that are four or greater bonds away usually do not influence each other.
2.2 A hydrogen atom with a nuclecus in a spin state of +1/2 produces a slightly different magnetic field than a one in a –1/2 spin state.
2.3 Even in a strong magnetic field, across a population of molecules, there is only a very slight excess of nuclei in the +1/2 spin state.
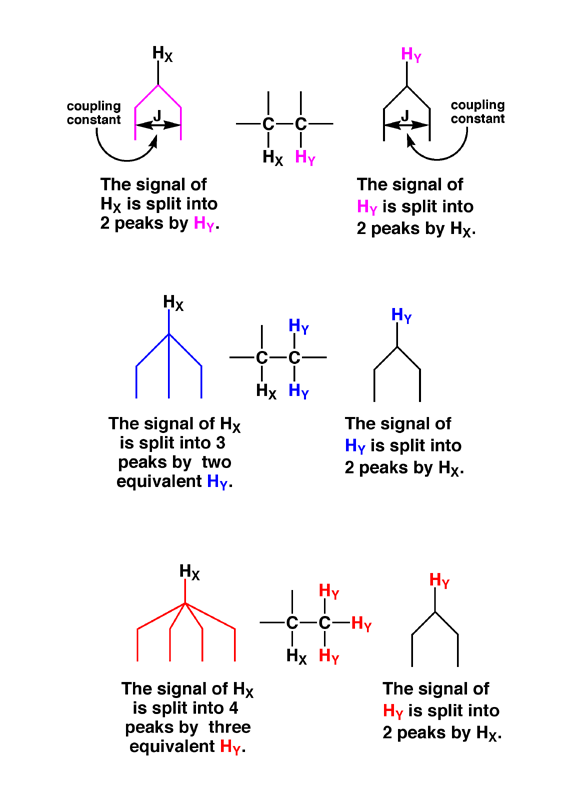
2.4 Putting all of these ideas together means the following: Consider a hydrogen X adjacent (three bonds away) to another hydrogen Y in a molecule. In around half of the molecules in the NMR sample, hydrogen X feels the magnetic field from a Y with nuclear spin of +1/2. The other half feel from Y a nuclear spin of –1/2. Thus, when you look at the spectrum, there are actually two different, but closely spaced peaks as the signal for hydrogen X. This phenomenon is called “spin-spin” splitting, and the distance between the two signals for X is called the “coupling constant”, often denoted as “J”. Similarly, the signal for Y actually has two peaks because of spin-spin splitting by X.
2.5 Consider a –CH2- group adjacent to a hydrogen X. Both of the hydrogen atoms in the –CH2- are chemically equivalent and could be either in the +1/2 or –1/2 nuclear spin state. Thus, there are three situations possible: i) +1/2,+1/2; ii) +1/2,-1/2, which is the same as –1/2, +1/2 and iii) –1/2,-1/2. Thus, there are actually three different magnetic fields that are felt by X in molecules of the sample, in a 1:2:1 ratio. Thus, the signal for hydrogen X is split into three peaks in a 1:2:1 ratio.
2.6 The same holds for a –CH3 group, that will split an adjacent hydrogen signal into four peaks, with a 1:3:3:1 ratio. You should verify this for yourself by making all the possible combinations of nuclear spins for the three equivalent hydrogen atoms of a methyl group.
2.7 In the general case, N equivalent hydrogen atoms will split an adjacent signal into (N+1) peaks, with relative ratios that are predicted by Pascal’s triangle (Figure 13.16 in the book).

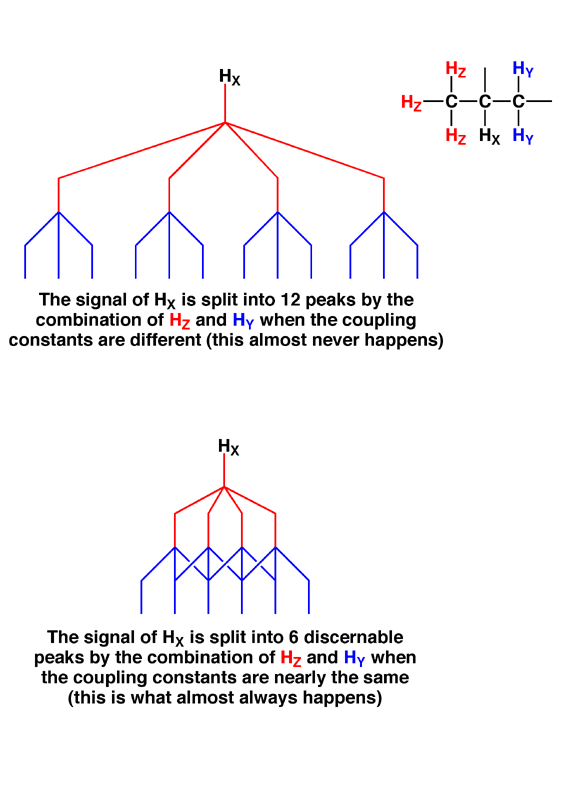
3.0 Following the same logic, the splitting should multiply if a single hydrogen atom is adjacent to hydrogen atoms on either side. Think about combining all the possible nuclear spin states for these nearby sets of hydrogen atoms. Thus, if you have a hydrogen atom X between one –CH2- and one –CH3 group, it should be split into an amazing (2+1) x (3 + 1) = 12 signals because there are that many different combinations of +1/2 and -1/2 spins possible.
3.1 Thus, if the coupling constants (J) from the –CH2- and –CH3 groups are significantly different from each other, then 12 peaks will be observed as the signal for hydrogen X.
3.2 However, in practice, coupling constants (J) are pretty close to the same value for almost all sets of hydrogen atoms in organic molecules, simplifying the splitting pattern, since now many of the twelve peaks will overlap with each other. What this means is that for almost all the spectra you will see, if a hydrogen X is surrounded by N hydrogen atoms, the signal for X will be split into only (N+1) peaks, no matter how those N hydrogen atoms are grouped in terms of sets of equivalent atoms. Thus, what is actually seen for the example above is that the signal for X would appear in the spectrum to be split into 2 + 3 + 1 = 6 peaks, not 12, peaks. This is the so-called “N+1” rule.
3.3 The diagram below shows these two different situations. When nuclei from hydrogen atoms Z and Y split the signal for hydrogen X with very different coupling constants (notice how the coupling constant J for the red Z hydrogen nuclei is larger than J for the blue Y hydrogen nuclei), all twelve peaks are spread out and identifiable. Below that is shown the situation in which the coupling constants are the same for nuclei of both Z and Y, so only 6 peaks are actually observed in the signal for hydrogen X due to extensive overlap. This latter case, with six peaks, is what you will almost always see in reality since coupling constants tend to be similar in organic molecules.

3.3 The above explanation of splitting can confuse students for a while. The important point is that in the example given, you see 6 different peaks in the spectrum (N+1 rule) even though there are really 12 peaks produced, it is just that several of them are on top of each other because the coupling constants are the same. For alkyl groups in organic molecules, the coupling constants are generally the same so you will almost always see the fewer peaks, corresponding to the simple N+1 rule, rather than the greater number of peaks derived from the multiplication rule.
3.4 The bottom line here is that by seeing how a given signal is split, you can figure out how many hydrogen atoms are adjacent on the molecule, namely the number of peaks in the signal minus 1. From this information you can piece together what a molecule looks like if you know how many atoms of each type are present (i.e. the molecular formula such as C4H10N2O). You get the molecular formula information from something called a mass spectrum, described later in the text. Molecular formulas will be provided to you in homework or test questions.
4.0 For a given signal, integrating the signal (include all splitting peaks for a given signal) gives you a relative value that is proportional to the number of equivalent hydrogen atoms that gave rise to the signal. Thus, by looking at the integration values, you can deduce how many of each type of equivalent hydrogen atoms are in the molecule. For example, a -CH3 group would have a signal that integrates to a relative value of 3 (no matter how the signal is split), and a -CH2- group would have a relative integration of 2, etc. Note that sometimes integrations are simply given as absolute numbers, and you must find the common factor to deduce how many hydrogen atoms are represented by each integration value.
5.0 Putting it all together: How to deduce a structure from an NMR spectrum. First, you must be given the molecular formula, so you know how many of each type of atom are present. Second, count the number of different signals and their relative integrations to see how many different sets of equivalent hydrogen atoms are in a molecule, and how many of each set are present. Compare the chemical shifts of each signal to tables to identify what functional groups are present. Finally, use the signal splittings to determine which hydrogen atoms must be no more than 3 bonds away from each other.
6.0 For alkenes, the pi bond prevents bond rotation so the different hydrogen atoms on an unsymmetrical alkene are not equivalent, so they all have different signals, and splitting follows the multiplicative rule (the coupling constants are usually significantly different for geminal vs. cis. vs. trans relationships).
7.0 For hydrogens in a -CH2- group adjacent to a chiral center, the two different H atoms are no longer equivalent, because even with bond rotation, the two hydrogens are never in the same environment with respect to the groups on the adjacent chiral center. Thus, each H of -CH2- group adjacent to a chiral center usually has its own signal in the NMR spectrum.
8.0 There is a great deal more to NMR than this, I am only trying to give you the basics here.

