Only 8$ per sample for interpreting of your EDS spectrum
and 10$ per sample for interpreting of your SEM/TEM micrograghsPayment Upon Completion
Send your results...
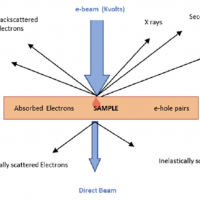
X-ray is a kind of electromagnetic wave, the same as light. The wavelength of visible light is 400 to 800nm, while the wavelength of x-ray is much shorter (higher energy), at 0.001nm to 10nm, and is known to have strong penetrating power.
Only 10 $ per sample for interpreting of your SEM/TEM/AFM micrograph
Payment Upon Completion

Send your micrographs...
The Scanning Electron Microscope (SEM) produces images by probing the specimen with a focused electron beam that is scanned across a rectangular area of the specimen (raster scanning).
Only 15$ per sample for interpreting of your NMR spectrum
Payment Upon Completion
Send your results...
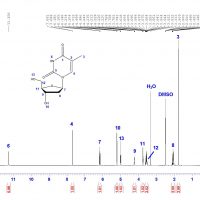
Nuclear Magnetic Resonance (NMR) spectroscopy is an incredibly powerful tool for characterizing molecular structures. When submitting to the FDA or other regulatory agencies, full structural characterization by NMR provides crucial evidence of compound identity. A combination of 1-dimensional and 2-dimensional NMR experiments are necessary for complete confidence in chemical structure.
Only 15$ per sample for interpreting of your NMR spectrum
Payment Upon Completion
Send your results...
Over the past fifty years nuclear magnetic resonance spectroscopy, commonly referred to as nmr, has become the preeminent technique for determining the structure of organic compounds. Of all the spectroscopic methods, it is the only one for which a complete analysis and interpretation of the entire spectrum is normally expected. Although larger amounts of sample are needed than for mass spectroscopy, nmr is non-destructive, and with modern instruments good data may be obtained from samples weighing less than a milligram. To be successful in using nmr as an analytical tool, it is necessary to understand the physical principles on which the methods are based.
Only 10 $per sample  for interpreting of your FT-IR spectrum
Payment Upon Completion

Send your spectra...
Infrared (IR) spectroscopy is based on molecular vibrations caused by the oscillation of molecular dipoles. Bonds have characteristic vibrations depending on the atoms in the bond, the number of bonds and the orientation of those bonds with respect to the rest of the molecule. Thus, different molecules have specific spectra that can be collected for use in distinguishing products or identifying an unknown substance (to an extent.)
Only 8$ per sample for interpreting of your TGA thermogram
Payment Upon Completion

 Send your thermograms...
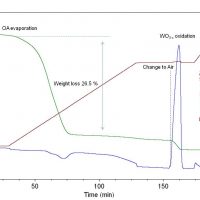
In thermogravimetric analysis (TGA), a sample is continually weighted while heating, as an inert gas atmosphere is passed over it. Many solids undergo reactions that evolve gaseous byproducts. In TGA, these gaseous byproducts are removed and changes in the remaining mass of the sample are recorded. Three variations are commonly employed:
Only 10 $ per sample  for interpreting of your SEM/TEM/AFM micrograph
Payment Upon Completion

Send your micrographs...
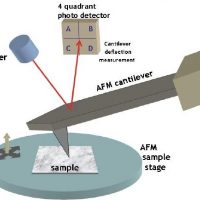
Atomic force microscopy (AFM) is a technique with multiple applications in biology. This method is a member of the broad family of scanning probe microscopy and was initially developed in 1986 by Binnig et al to overcome the disadvantages of the scanning tunneling microscopy (STM) [1]. In the case of STM, only conductive materials can be studied as the resolution is obtained by using a tunneling current between a sharp probe and the sample surface[1]. In contrast, AFM uses small forces on the surface by a probe, thus do not damage samples and can provide information of surface topography of biological materials. AFM soon attracted the attention of the biophysical scientists in biomembrane as well as synthetic membrane research due to its capability of observing biological molecular system with resolution on nanometer scale and its possibility of three dimensional imaging [2].
Only 10$ for interpretation of your VSM curve
Payment Upon Completion

 Send your VSM curves...
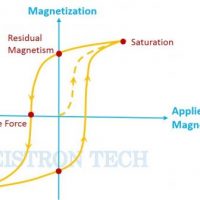
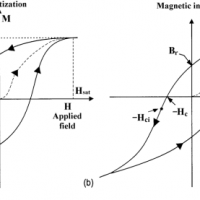
Vibrating Sample Magnetometry (VSM) is a measurement technique which allows to determine the magnetic moment of a sample with very high precision. The aim of this lab course M106 is to enlarge upon the use of this widespread technique introduced in the lab course B512, where different ferromagnetic samples were characterized concerning magnetic hysteresis and demagnetization. Here, we will gain a deeper understanding of the behavior of magnetic materials and its measurement.
Only 10$ for interpretation of your VSM curve
Payment Upon Completion

 Send your VSM curves...
Operation
A sample is made to oscillate using a vibrational unit extended on a rod. The sample is placed between two electromagnetic pieces which are used as the applied field for this this experiment. With the sample oscillating induces a voltage between the search coils which creates a signal to determine the magnetic properties of the sample. Reference coils are used to create a reference signal such that noise generated from the signal can be filtered using a lock-in amplifier [1]. Because the signal and the reference signal are directly related through its voltage and amplitude means that precise measurements can be recorded using a voltmeter. Calibration methods are important to determine the relation between the voltages induced by the magnetic field and the sample and their magnetic properties.
Only 10$ for interpretation of your BET results

Payment Upon Completion
Send your results...
Introduction to BET (Brunauer, Emmett and Teller)
By BET (Brunauer, Emmett and Teller) the specific surface area of a sample is measured – including the pore size distribution. This information is used to predict the dissolution rate, as this rate is proportional to the specific surface area. Thus, the surface area can be used to predict bioavailability. Further it is useful in evaluation of product performance and manufacturing consistency.