Only 10 $ for interpretation of your FT-IR spectrum
Payment Upon Completion

Send your spectra...
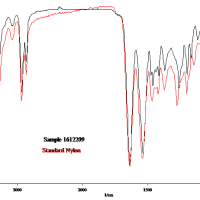
The N–H stretches of amines are in the region 3300-3000 cm-1. These bands are weaker and sharper than those of the alcohol O–H stretches which appear in the same region. In primary amines (RNH2), there are two bands in this region, the asymmetrical N–H stretch and the symmetrical N–H stretch.
Only 10 $ for interpretation of your FT-IR spectrum
Payment Upon Completion

Send your spectra...
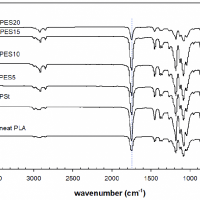
1. Determine the X-axis and the Y-axis of the spectrum. The X-axis of an IR spectrum is labeled as “Wavenumber” and ranges in number from 400 on the far right to 4,000 on the far left. The X-axis provides the absorption number. The Y-axis is labeled as “Percent Transmittance” and ranges in number from 0 on the bottom and 100 at the top.
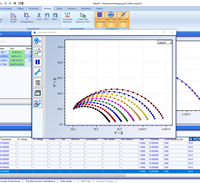
Only 10$ for interpretation of your VSM curve
Payment Upon Completion

 Send your VSM curves...
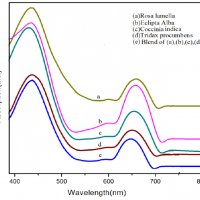
An obvious difference between certain compounds is their color. Thus, quinone is yellow; chlorophyll is green; the 2,4-dinitrophenylhydrazone derivatives of aldehydes and ketones range in color from bright yellow to deep red, depending on double bond conjugation; and aspirin is colorless. In this respect the human eye is functioning as a spectrometer analyzing the light reflected from the surface of a solid or passing through a liquid.
Our XRD interpretation includes:
1. Phase determination
2. Determination of diffracted planes
3- Calculation of crystalline size and microstrain
4- Whatever your request
Its cost is only 12$Payment Upon Completion
Send your patterns...
X-ray diffraction (XRD) is a technique used in materials science for determining the atomic and molecular structure of a material. This is done by irradiating a sample of the material with incident X-rays and then measuring the intensities and scattering angles of the X-rays that are scattered by the material. The intensity of the scattered X-rays are plotted as a function of the scattering angle, and the structure of the material is determined from the analysis of the location, in angle, and the intensities of scattered intensity peaks. Beyond being able to measure the average positions of the atoms in the crystal, information on how the actual structure deviates from the ideal one, resulting for example from internal stress or from defects, can be determined.
Only 10 $ for interpretation of each element in your XPS spectrum
Payment Upon Completion

Send your spectra...
X-Ray photoelectron spectroscopy (XPS), also known as electron spectroscopy for chemical analysis (ESCA) is a non-destructive technique used to analyze the surface of a material. The XPS will measure the elemental composition, chemical state as well as the electronic state, thickness measurements of overlayers (up to 8nm), and will give you the empirical formula of the material that is being analyzed. This instrument will only detect elements with an atomic number higher of 3 and higher since hydrogen and helium atoms are very small and the probability of detecting them is almost zero. Also, it can only analyze depths ranging from 1 to 10nm, for this reason it only gives analysis of the surface. Preparation of the samples is minimal if any; you can analyze samples “as receive” or can clean the surface to eliminate any contaminates that might be present. Some examples that can be analyzed using the XPS are elements, metal alloys, semiconductors polymers, ceramics, and inorganic compounds. Other examples include paints, inks, viscous oils, wood and papers.
Only 10 $ for interpretation of your EIS spectrum
Payment Upon Completion

Send your EIS spectra...
Electrochemical Impedance Spectroscopy (EIS) can be a useful tool for differentiating today’s high-performance coating systems. These advanced coatings with their improved barrier properties perform longer in-service environments that are notoriously challenging. The use of accelerated weathering/corrosion testing in the laboratory to differentiate coating performance is still viable, but can take a year or longer, versus 3-4 months that were used just a decade or so ago, which creates longer lead times to market and increased testing costs.