Free software for EDS analysis

Click here to see other posts about EDS Only 8$ for interpretation of your EDS spectrum and 10$ per sample for interpreting of your SEM/TEM micrograghs Payment Upon Completion Send your results... 1- DTSA-II DTSA-II is a multi-platform software package for quantitative x-ray microanalysis. DTSA-II was inspired by the popular Desktop Spectrum Analyzer (DTSA) package d...
Read more

What is Raman spectroscopy?

What is Raman spectroscopy?
Click here to see other posts about Raman Only 10 $ per sample for interpreting of your Raman spectrum Payment Upon Completion Contact us... In this course the general introduction to Raman spectroscopy and microscopy will be provided and practical tips as well as examples will be given. The capability of Raman spectroscopy for the analysis of real-life samples (paint ...
Read more

How EDS works?

How EDS works?
Click here to see other posts about EDS Only 8$ per sample for interpreting of your EDS spectrum and 10$ per sample for interpreting of your SEM/TEM micrograghs Payment Upon Completion Send your results... Interaction of an electron beam with a sample target produces a variety of emissions, including x-rays. An energy-dispersive (EDS) detector is used to separate ...
Read more

Fundamentals of Energy-dispersive X-ray spectroscopy (EDS)

Fundamentals of Energy-dispersive X-ray spectroscopy (EDS)
Click here to see other posts about EDS Only 8$ per sample for interpreting of your EDS spectrum and 10$ per sample for interpreting of your SEM/TEM micrograghs Payment Upon Completion Send your results... X-ray is a kind of electromagnetic wave, the same as light. The wavelength of visible light is 400 to 800nm, while the wavelength of x-ray is much shorter (higher en...
Read more

What are the main differences between an SEM, an ESEM, an SEM-FIB and an (S)TEM?

What are the main differences between an SEM, an ESEM, an SEM-FIB and an (S)TEM?
Click here to see other posts about SEM Only 10 $ per sample for interpreting of your SEM/TEM/AFM micrograph Payment Upon Completion Send your micrographs... The Scanning Electron Microscope (SEM) produces images by probing the specimen with a focused electron beam that is scanned across a rectangular area of the specimen (raster scanning). (more…)
Read more

Interpretation steps of a NMR spectrum

Interpretation steps of a NMR spectrum
Click here to see more posts about NMR Only 15$ per sample for interpreting of your NMR spectrum Payment Upon Completion Send your results... Nuclear Magnetic Resonance (NMR) spectroscopy is an incredibly powerful tool for characterizing molecular structures. When submitting to the FDA or other regulatory agencies, full structural characterization by NMR provides crucial...
Read more

Fundamentals of Nuclear Magnetic Resonance Spectroscopy

Fundamentals of Nuclear Magnetic Resonance Spectroscopy
Click here to see more posts about NMR Only 15$ per sample for interpreting of your NMR spectrum Payment Upon Completion Send your results... Over the past fifty years nuclear magnetic resonance spectroscopy, commonly referred to as nmr, has become the preeminent technique for determining the structure of organic compounds. Of all the spectroscopic methods, it is the onl...
Read more

A to Z of IR Spectroscopy

A to Z of IR Spectroscopy
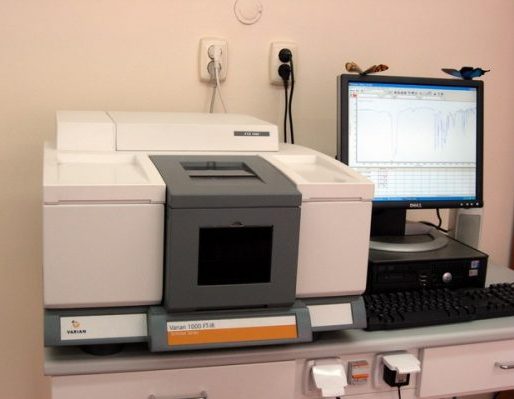
Click here to see other posts about FT-IR Only 10 $per sample for interpreting of your FT-IR spectrum Payment Upon Completion Send your spectra... Infrared (IR) spectroscopy is based on molecular vibrations caused by the oscillation of molecular dipoles. Bonds have characteristic vibrations depending on the atoms in the bond, the number of bonds and the orientation of ...
Read more

How to analyze TGA thermograms

How to analyze TGA thermograms
Click here to see other posts about TGA/DTG Only 8$ per sample for interpreting of your TGA thermogram Payment Upon Completion Send your thermograms... In thermogravimetric analysis (TGA), a sample is continually weighted while heating, as an inert gas atmosphere is passed over it. Many solids undergo reactions that evolve gaseous byproducts. In TGA, these gaseous bypr...
Read more

A to Z of Atomic force microscopy (AFM)

A to Z of Atomic force microscopy (AFM)
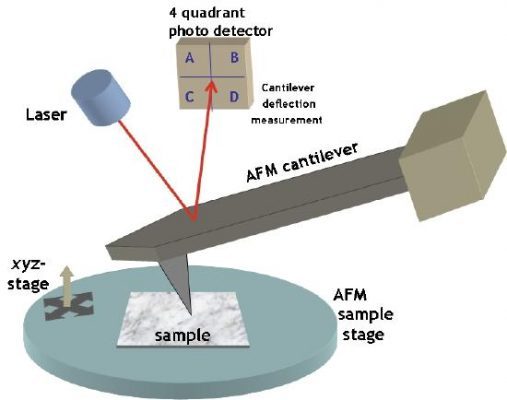
Click here to see other posts about AFM Only 10 $ per sample for interpreting of your SEM/TEM/AFM micrograph Payment Upon Completion Send your micrographs... Atomic force microscopy (AFM) is a technique with multiple applications in biology. This method is a member of the broad family of scanning probe microscopy and was initially developed in 1986 by Binnig et al to o...
Read more