Unveiling the Mysteries of Mxene: Exploring 5 Advanced Characterization Methods (XRD, Raman, XPS, UV-Vis, and FT-IR) for Enhanced Material Understanding

Mxene
Only 10 $ per sample for interpreting of your FT-IR, Raman, XRD, UV-Vis, and XPS spectrum Payment Upon Completion Send your spectra... What is Mxene? Mxene is a class of two-dimensional (2D) transition metal carbides, nitrides, and carbonitrides that exhibit unique properties such as high electrical conductivity, excellent mechanical strength, and high surface areas. M...
Read more
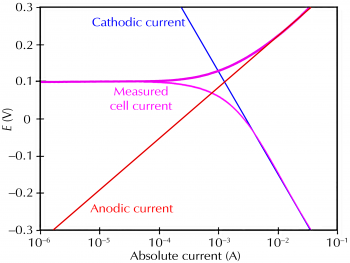
What are differences between EIS and polarization methods for corrosion monitoring?

How to analyze polarization curves?
Corrosion is a major concern in many industries, as it can cause significant damage to infrastructure and equipment. To prevent corrosion, it is important to monitor the corrosion rate and take appropriate measures to mitigate it. (more…)
Read more

How to calculate unknown concentration using UV-Vis spectroscopy?

How to calculate unknown concentration using UV-Vis spectroscopy?
Click here to see more posts about UV-Vis spectroscopy Only 10$ per sample for interpreting of your UV-Vis spectrum Payment Upon Completion Send your UV-Vis spectra… It is well known that determination of concentrations of materials in different solutions is an important step for investigation of the under-studied solution. Usually, photometric techniques ...
Read more

Interpreting & Analyzing of FTIR Results for Beginners

Click here to see other posts about FT-IR Only 10 $ per sample for interpreting of your FT-IR spectrum Payment Upon Completion Send your spectra... Fourier transform infrared spectroscopy (FTIR) is an experimental test to identify organic/inorganic materials. But for understanding and interpretation of FTIR results, the principles of the analysis should be studied. ...
Read more

Raman Spectroscopic Study of Graphene

Raman Spectroscopic Study of Graphene
Click here to see other posts about Raman Only 10 $ per sample for interpreting of your Raman spectrum Payment Upon Completion Contact us... We present here results on a Raman spectroscopic study of the deposited defected graphene on Si substrates by chemical vapor deposition (thermal decomposition of acetone). The graphene films are not deposited on the (001) Si subst...
Read more

Corrosion monitoring using EIS and polarization techniques

Corrosion monitoring using EIS and polarization techniques
See more posts about EIS and polarization tests Only 10$ per sample for interpreting of your polarization and EIS results Payment Upon Completion Send your polarization/EIS results... The corrosion mechanism taking place in an aqueous phase with or without mechanical contact is electrochemical in nature. The electrochemical signal is one of the primary sources of info...
Read more

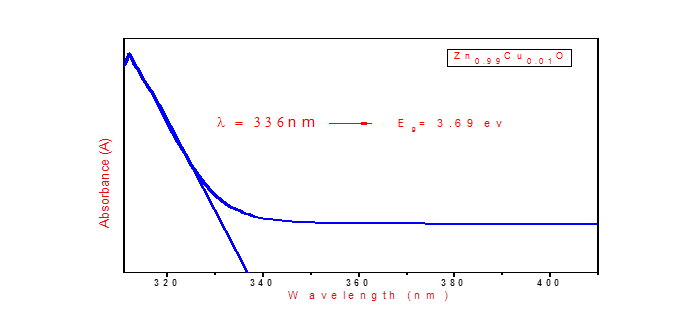
Determination of band gap using UV-Vis spectra

Determination of band gap using UV-Vis spectra
Click here to see more posts about UV-Vis spectroscopy Only 10$ per sample for interpreting of your UV-Vis spectrum Payment Upon Completion Send your UV-Vis spectra... STEP1: Open the absorption graph of the material, which is obtained from the UV Vis spectroscopy. Theory Behind Calculations: UV Vis Spectroscopy absorption peak means the Electrons are abs...
Read more

Quantification of FT-IR spectrum

Quantification of FT-IR spectrum
Click here to see other posts about FT-IR Only 10 $ per sample for interpreting of your FT-IR spectrum Payment Upon Completion Send your spectra... FTIR Spectroscopy is an analytical technique used to identify organic, polymeric, and, in some cases, inorganic materials. The FTIR analysis method uses infrared light to scan testsamples and observe...
Read more

Free software for fitting EIS spectra

Free software for fitting EIS spectra
Contact us for more information about downloading of EC-lab, Zview and ZsimpWin Only 10$ per sample for interpreting of your EIS spectrum Payment Upon Completion Send your EIS spectra... EIS Spectrum Analyser EIS Spectrum Analyser is a standalone program for analysis and simulation of impedance spectra. The analyser routine is based on algorithms of the PD...
Read more

Free software for EDS analysis

Click here to see other posts about EDS Only 8$ for interpretation of your EDS spectrum and 10$ per sample for interpreting of your SEM/TEM micrograghs Payment Upon Completion Send your results... 1- DTSA-II DTSA-II is a multi-platform software package for quantitative x-ray microanalysis. DTSA-II was inspired by the popular Desktop Spectrum Analyzer (DTSA) package d...
Read more